Why Restaurants Aren't Typical Retail
Key Highlights
- Interface Systems' 2026 Restaurant Security Benchmark Report – built on 1.1 million monitored events across 9,392 locations – finds that loiterers and disturbances drive 74% of serious restaurant incidents, while theft registers just 1.3%, making retail-style security programs largely irrelevant in this vertical.
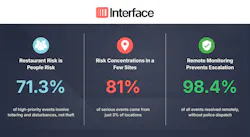
- Risk concentration is extreme: 3% of locations generated 81% of all high-priority events, and the single worst hour of the day is 6 PM – meaning uniform security spend across a multi-unit portfolio consistently overprotects the 97% and underprotects the locations that carry actual risk.
- Restaurant employees submitted 82,248 requests for live monitoring support over the year – roughly 225 daily – giving integrators a compelling retention argument: a documented safety culture reduces turnover in one of the most chronically understaffed industries in the country.

This article originally appeared in the August 2026 issue of Security Business magazine. Don’t forget to mention Security Business magazine on LinkedIn or our other social handles if you share it.
If you have been selling restaurant security accounts the same way you sell retail, the data says you are solving the wrong problem.
That is the central finding of Interface Systems' 2026 Restaurant Security Benchmark Report, and it is one that integrators serving the food service vertical would do well to internalize. The report is built on an unusually large dataset – 1.1 million monitored events, 9,392 locations, 78 brands – and its findings challenge several assumptions that have long shaped how the security industry approaches this vertical.
The biggest one: restaurant security is fundamentally a people problem, not a merchandise problem. Loiterers and panhandlers accounted for 51.7% of all high-priority restaurant events during the reporting period. Disturbances added another 22.3%. Together, those two categories drove nearly three out of four serious incidents. Theft and loss – the dominant threat in retail at 65.9% of events – registered just 1.3% at restaurants.
The implication for integrators is direct. A security program built on retail assumptions – heavy on POS analytics and interior camera coverage – is largely irrelevant against a late-night encampment in the parking lot or an aggressive panhandler at the drive-thru window. Restaurant operators need perimeter protection and intervention capability, not merchandise surveillance.
The 3% Problem
The report's risk concentration data is striking. Spread 13,486 high-priority events across 9,392 locations and the average looks manageable – 1.4 serious incidents per site per year. But averages mislead. A total of 715 locations logged exactly one high-priority event all year. Meanwhile, a small group of locations recorded ten or more, and that group – just 3% of the network – accounted for 10,891 events, or 81% of the total. The top 100 locations alone generated 59% of all high-priority incidents.
For integrators, this is one of the most actionable findings in the report. Uniform security spend across a multi-unit portfolio quietly overprotects the 97% and underprotects the 3% that carry the actual risk. The smarter play is tiered coverage: use monitoring data and video analytics to identify high-risk locations, concentrate intervention capability there, and run lighter verification-focused coverage everywhere else.
Geography sharpens the point further. California produced 5,449 events – 40% of the national total – at 3.3 events per monitored site. Hawaii averaged 16.8 high-priority events per monitored site, the highest in the country. The national average was 1.4. For integrators managing multi-state portfolios, those regional differences should inform both proposal strategy and coverage design.
There Is No Safe Hour
The timing data challenges another common assumption: that the overnight hours are when restaurants face their greatest exposure. The reality is more complicated.
The single worst hour of the day is 6 PM, which logged 851 high-priority events across the reporting period. It lands exactly when every pair of hands is on the line and managers are least able to deal with a parking lot dispute. But the overnight hours carry their own risk profile. Roughly 30% of all high-priority events fall between 10 PM and 6 AM, and 2 AM is the single busiest hour for dispatches across all event types. Sunday events were dispatched at a 67% rate – compared to 59% on Friday and Saturday – because fewer staff on site means the incidents that surface tend to be more serious.
The seasonal data inverts conventional wisdom as well. Most security thinking treats summer as peak crime season. Restaurant data says winter. January was the worst month of the year with 1,514 events, running 61% above June's low of 943. December through February produced nearly 30% of the annual total. The worst single day of the reporting period was January 29, with 94 events.
Holiday patterns add another layer. Risk surrounds the holiday rather than landing on it. Christmas Day was the quietest day of the year at 14 events, but Christmas Eve ran three times higher at 44. Presidents Day logged 44 events while the day after spiked to 74 – the highest of any holiday window – as properties came back to life after the long weekend. Integrators who can help operators plan coverage around these windows are delivering value that goes well beyond hardware.
The False Alarm Tax
False alarms rarely appear on the loss prevention dashboard, but they carry real cost. The Interface data logged 296,265 false alarms during the reporting period – 31.5 per site for the year, roughly 812 every day, and 22 false alarms for every genuine high-priority event.
Their timing is the tell. Forty-four percent fired between 7 and 10 AM, with the 8 AM hour alone producing 57,934. A second surge runs from 10 PM to 1 AM. These are opening crews fumbling disarm codes, new hires on a first solo open, managers propping a back door before the panel is off. Procedural errors, not crime.
Every false alarm that reaches a police dispatcher carries a cost: municipal fines that commonly run $250 to $6,350 per incident, eroded response priority for the alarms that actually matter, and staff conditioned to treat sirens as background noise. Video verification absorbed more than 97% of the year's false alarms before they became dispatches, fines, or 4 AM phone calls to a district manager. For integrators, that number makes a compelling case for managed alarm programs paired with video verification – and it gives operators a concrete ROI conversation to bring to the CFO.
225 Requests for Help Every Day
Perhaps the most underappreciated finding in the report is this: restaurant employees initiated 82,248 requests for live monitoring support over the year. That works out to roughly 225 every day.
The breakdown tells its own story. Staff submitted 67,220 requests to have a developing situation monitored, 14,378 requests for a voice-down announcement to move someone along, and 650 requests for a virtual security escort while an employee walked to a car, opened the store, or handled a deposit. Security escort demand peaked in June and December – months of long days, late closes, and holiday cash.
Set those numbers against the 406 battery and assault events and 302 medical emergencies recorded during the same period and the demand makes sense. Front-line restaurant workers face volatile situations routinely, often at night, often alone. When backup is available, they reach for it.
There is a retention argument here that integrators can help LP leaders take to the C-suite. Turnover remains one of the most expensive line items in restaurant operations, and perceived safety shapes whether crew members stay. A documented record of 82,000 answered requests for help is evidence of a safety culture, not just a security expense. Integrators who frame monitoring capability in those terms are speaking the language of operations leadership, not just loss prevention.
What the Data Means for Integrators
The 2026 Interface benchmark gives integrators something valuable: a data-driven frame for a more sophisticated conversation with multi-unit restaurant operators. The findings suggest several concrete areas where integrators can add value beyond the initial deployment.
Risk-tiered coverage design. The 3% concentration finding is the starting point. Operators who apply uniform security spend across a portfolio are misallocating resources by definition. Integrators who can help rank locations by incident frequency and match coverage to actual risk profiles are delivering a consulting capability that most operators cannot replicate internally.
Perimeter-first thinking. Three out of four serious restaurant incidents involve people on the property, not products off the shelf. That means the security conversation should start at the property line – AI-enabled cameras flagging activity in lots and drive-thrus, audio deterrence capability, and trained remote specialists who can intervene before a situation reaches the counter.
Monitoring that covers the full clock. The data shows meaningful exposure at 6 PM, overnight, on weekends, and in the days surrounding holidays. Operators running skeleton crews or closed locations during those windows need monitoring capability that compensates for the absence of on-site staff – and the dispatch rate data shows that the incidents that surface during low-staffed hours tend to be serious ones.
False alarm management as a selling point. The 22-to-1 false alarm ratio is a pain point that operators feel but rarely quantify. Video verification and managed alarm programs address it directly – and the cost savings from avoided fines and preserved dispatch priority are measurable.
The employee safety conversation. The 225 daily staff assistance requests are an opening for a conversation about what it means to give front-line workers a credible safety net. Two-way audio, virtual escorts, and live monitoring during vulnerable windows – closings, cash runs, solo opens – are capabilities that resonate with operations leaders trying to reduce turnover in a chronically understaffed industry.
The full 2026 Restaurant Security Benchmark Report, including detailed charts, a restaurant-versus-retail threat comparison, and a self-benchmarking tool, is available at interfacesystems.com.