Virtual Port Concept Powers Unique Security Project
Port Description
The Port of Long Beach (POLB) is one of America’s premier seaports and a trailblazer in goods movement and environmental stewardship. Trade valued annually at more than $180 billion moves through Long Beach, making it the second-busiest seaport in the United States. A major economic force, the Port supports more than 30,000 jobs in Long Beach, 316,000 jobs throughout Southern California and 1.4 million jobs throughout the United States. It generates about $16 billion in annual trade-related wages statewide.
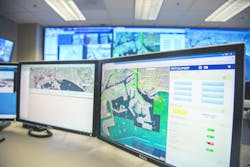
Protecting the port complex is vital to our national economic and security interests. The Port’s security teams and its partners are committed to protecting this national asset and the surrounding community. The Port of Long Beach Joint Command & Control Center (JCCC) is a critical hub of a coordinated security effort that includes partnerships with multiple agencies including local and state law enforcement, the U.S. Coast Guard, U.S. Customs and Border Protection and others. The JCCC monitors the maritime domain 24 hours a day, gathering information, analyzing data and disseminating information to security partners. The Port of Long Beach has formalized agreements with regional security partners and Port security stakeholders, including marine terminal operators, to share security information, conduct joint training and operations, and coordinate threat information.
The Integrated Solution
Background
As POLB worked to create a world class security automation program, the need to store, sort, prioritize and manipulate data became evident. It was determined early in the benchmarking process that no product existed in the marketplace and that no off-the-shelf solutions were available. The Security Division immediately started to look into various independent solutions that could provide special capabilities necessary to accomplish the overarching detail that the Port was attempting to achieve. The focus of that activity was primarily Geographic Imaging Systems (GIS) and the visual representation of data that could be acquired through that type of system. Through a request for statement of qualification process and a subsequent white paper and demonstration process, potential developers of the Virtual Port system were identified and evaluated. The team led by Environmental Systems Research Institute (Esri) was selected to develop the Virtual Port platform.
Virtual Port provides a dynamic operational planning tool for real time status of activities and events throughout the Port. It supplies Port stakeholders with timely data for business resiliency, daily operations, threat and incident response, asset & property management and event documentation. Virtual Port is a user friendly, geo-spatially based system. It is a modular platform that consists of numerous independent software applications that create a tool box concept. Virtual Port has four (4) primary data sources: storage of historical data; collection of dynamic, open-source data; visualization date, pictures, maps, charts, etc.; and built-in process/incident models. The platform is a pull system for sharing bidirectional information from the operator’s viewpoint. Reports and incident data can be distributed to pre-identified users. Virtual Port is not a control platform; it is an informational tool for referencing, modeling and processing existing information.
Goals and Objectives
- To enhance maritime domain awareness capabilities of the Joint Command & Control Center
- To provide a common operational picture of Port operations to support security, response, and business continuity.
- To integrate with the existing CCTV system; incorporating feeds from all cameras in the port-wide camera system, allowing users to access a real time view of the locations.
- To provide data to regional first responders (such as, Long Beach Police and Fire Departments), giving them real time, onsite access to the Virtual Port software.
The purpose of the Virtual Port Project was to develop an advanced domain awareness tool that focuses on creating a picture of what is happening in or impacting Port operations in real time. This information is utilized for creating a common operational picture for deployment of resources or re-directing of assets under the Port’s control. The platform graphically represents information so that it can be easily understood by security control center operators.
A collection of historical data, such as GIS based drawings, maps, “as builts”, etc., is available as static information on the platform. The GIS feature allows for modeling information for evacuation and business continuity purposes. This enables control center operators to direct maintenance crews and security staff to locations where critical actions would be required. Examples of static information include power grids, water lines and their shut off valves, surveillance installation drawings, network configurations, etc.
The third element of the platform is visualization, which includes embedding of still pictures and video clips of critical infra-structure for historical reference. The visual images can be matched to live feeds from the Port’s camera systems. The final component is the data mining element. The Port’s vision is to take shipping data from the Marine Exchange, Blue Force tracking, trucking data from TWIC and the Clean Truck Program, RFID information when it becomes available and various open source information for traffic, weather and general news agencies.
This information automatically displays itself and removes its associated identifier from the grid when it is no longer significant for system display. This provides an operator the best virtual picture of what is occurring in the Port at any given time.
Methodology
The Virtual Port platform was developed in phases. The Virtual Port Working Group consisting of various stakeholders within the port region identified capabilities that were developed and incorporated into the operational capability (IOC) of Virtual Port. The Virtual Port system utilizes a map-centric situational awareness application to provide a user friendly screen to reach the various capability modules and data. It is simple to use and navigates through rich layers of information. The simplicity of design and web based development allows it to be accessed and utilized on mobile tablet devices (e.g. iPad). The platform continues to evolve in its development, providing the opportunity to include additional layers of data to optimize visualization of the Port.
Conclusion
Virtual Port addresses operational needs, domain awareness, security protection issues and critical infra-structure status throughout the port complex. Although GIS is an established application with widespread use, it has not been utilized as an interactive dash board for Maritime Domain Awareness. Virtual Port combines over 50 data sources to give a layered picture of traffic, ship movements, events occurring in the port, etc. which leads to a comprehensive picture of what is taking place throughout the port complex.
Virtual Port reduces and in some cases eliminates the human element to update the data which serves its users. Through a multitude of automated vetted sources, Virtual Port displays the most current up-to-date status of operations in the Port complex without a large number of individuals manually loading the information into the system. The information is widespread from vessel movements and ownership issues, to vehicle traffic, to environmental concerns and for daily operational issues.
Virtual Port is fully operational and being utilized by the Joint Command & Control Center on a daily basis. It is used by over 14 regional stakeholders, and receives over 300 updates to the system daily. It is a true picture of the port.
About the Author:
Randy D. Parsons is the Director of Security for the Port of Long Beach.
POLB Project Notes:
Project Partners:
- CAPT. Jennifer Williams, U.S. Coast Guard
- Commander Randy Allen, Long Beach Police Department
- Deputy Chief Mike Sarjeant, Long Beach Fire Department
- Chief Ron Boyd, Los Angeles Port Police
- Deputy Chief Robert Green, Los Angeles Police Department
- Chief Deputy Mario Rueda, Los Angeles Fire Department
- Kip Louttit, Marine Exchange of Los Angeles/Long Beach
Project Solution Providers:
- Esri
- IHS Global, Inc.
- WeatherFlow, Inc
- Witt O’Brien’s, LLC.
- Datamyne
- GNIP
- Lanair
- SSR
- Marine Exchange
- General Dynamics
- Port of Long Beach
Port of Long Beach Project Capabilities Summary
Capabilities – Phase 1
Situational Awareness Application:
- View and interact with a variety of base maps such as aerial photography, National Oceanic and Atmospheric Administration charts, and topography among others.
- View real time feeds of data on the map.
- Automatic Identification System (AIS) Vessel Tracking (San Pedro Bay) –POLB AIS/Radar system
- Radar Identified Vessel Tracking (San Pedro Bay)– POLB AIS/Radar system
- Blue Force Tracking – Raveon Blue Force tracking system
- Vessel Arrival, Departure, Shift (POLB) – Marine Exchange
- United States Geological Survey (USGS) Earthquakes and Tsunami Warnings (California) – USGS
- Weather Stations (San Pedro Bay)– WeatherFlow
- Special Event Locations (San Pedro Bay) – POLB Security
- Maritime Security (MARSEC) Level (Nationwide) – USCG
- Traffic (Nationwide) – Esri ArcGIS Online Subscription
- View reference data on the map and from the following sources:
- Leasing (POLB) – POLB Engineering
- Railroads (POLB) – POLB Engineering
- Fiber Optic (POLB) – POLB Engineering
- Sewers (POLB) – POLB Engineering
- Stormwater (POLB) – POLB Engineering
- Telecom (POLB) – POLB Engineering
- Water (POLB) – POLB Engineering
- Oil (POLB) – POLB Engineering
- Electrical (POLB) - POLB Engineering
- Anchorages and Berths (POLB) – POLB Engineering
- Camera Locations (POLB) – POLB Security
- Patrol Area Resources (POLB) – POLB Security
- Weather Station Locations (San Pedro Bay) – WeatherFlow
- Alert Locations (San Pedro Bay) – POLB Security
- LAR-IAC Imagery – Los Angeles Regional Imagery Acquisition Consortium
Special Modules
- Port Resources Module - Manage and allocate resources from multiple agencies. Resources can be pre-loaded and then manually allocated for date/time availability. Quickly see what resources are currently available across all agencies along with any special considerations or notes that have been tagged to each resource.
- Vessels Module - See details on all vessels currently within the San Pedro Bay region. View additional details such as vessel photographs along with being able to zoom to the current location of the vessel, follow a vessel or see historical vessel tracks.
- News Module - View relevant and filtered news feeds associated with the San Pedro Bay region. Users can manually “flag” articles of interest for sharing with others within the operations brief module.
- Operations Brief Module –Users manually add and maintain a daily log of special events, critical meetings, news / events, dignitary / VIP visits, Mission / Dive Operations, Exercises / Training, Road Conditions. The location of these items can be placed on the map for sharing with other users.
- Social Media Module - Search for key terms within Twitter streams to locate top links, photos, videos and tweets. If the tweet has a location, this location can be shown on the map. Users can “flag” tweets of interest for sharing with others within the daily operations brief.
- Alerting and Messaging - Manually create alerts and messages for dissemination to all users. Alerts created to automatically be sent out when a vessel enters an area that the user has sketched on the map (e.g. geofence). Users can take action on alerts and messages and log the action with the user that made the change.
- GeoFence (Virtual Boundary) - Geofence (Virtual Boundary) Users may create a custom virtual boundary anywhere on the map. Currently, if an AIS tracked vessel enters one of these areas an alert will be created.
- Vessel Reports - Report on vessels currently at, entering and departing a given pier, birth or anchorage area.
- Face First (Prototype) - Monitor who visited Port facilities utilizing facial recognition. System installed in JCCC. System creates alarms based on threat levels and required security measures.
- Information Monitoring View - A dashboard for users to quickly get updates on status of the various indicators being monitored within Virtual Port.
- Mobile Field Collection - Using Esri Commercial Off the Shelf (COTS) tools, ability to collect information in the field and push into the Virtual Port system using mobile devices supported by Esri’s ArcGIS Mobile platform.
Capabilities - Phase 2
- E-Mail Messaging - Integrated capabilities with external E-Mail server software in support of ability to forward alerts, general messages and operations brief content to email distribution lists. Provides the foundation for the Maritime Coordination Center (MCC) notification capabilities.
- Camera Integration & Management - Store and maintain camera details. POLB system administrators can add cameras, update camera details (owner, type, status, location), and give viewing privileges to users approved to have access to the camera data layer. This layer will not be shared with all Virtual Port users.
- Blue Force Tracking (BFT) - Integration with available BFT systems from stakeholder agency systems to provide ability to view live Blue Force tracks within the Virtual Port environment.
- Coast Guard Blue Force Tracking - Integration with the United States Coast Guard (USCG) encrypted Blue Force Tracking system. POLB’s SSR software supports this activity.
- Associate Photos and Vessels Identification - Esri is coordinating with SSR Engineering (POLB Radar / AIS provider) to review methods of alerting, capturing details (including photos) of all unidentified vessels (non-AIS) coming into the port.
- Enhanced Map Tools - Advanced map tools within the Virtual Port environment (e.g. measurement by different units, search by x,y, search by location name, etc.).
- Special Event Plan Sketch - Populate event action plan (EAP) map sketches within Virtual Port for support of operational planning. Users are able to sketch on a special event plan map template (web map) using a common “palette” of typical special event map symbols. This map is then accessible to all users within Virtual Port.
- Custom Vessel Reports - Two additional vessel reports are being provided (e.g. a report showing vessels of a given type arriving or leaving within next hour or a report showing only vessels that have never been in the POLB before).
- Maritime Coordination Center Joint Operations Brief (MJOB) and Overall Application Enhancements - Improvements to the calendar and scheduling tools such as ability to set a start and end date for MJOB reports.
- Plume Analysis - Upload plume output from Aloha modeling tools. Load multiple plumes and tie the plumes to an event. See the plume on the map, see plume changes over time and review the plume in context of other data within Virtual Port
- Perspective/Side View Imagery - View perspective “side view” imagery from Pictometry. This imagery is a “birds eye” view of a given area and provides the ability to look at the sides of facilities (e.g. during a SWAT event where users need to see better details of a facility location). The Pictometry imagery is provided from LARIAC as a part of the City of Long Beach GIS’s data subscription.
- Data Acquisition and Database Support - Additional data configuration support was conducted to meet the needs of the data collection process and to consolidate the expanding data volume being obtained from the various application sources (e.g. AIS, MX, etc.).
Capabilities – Phase 3
Maritime Coordination Center (MCC) Enhancements
- MJOB Enhancements - “MCC operations brief” specific to MCC needs and restricted by default to only MCC users (law enforcement sensitive). Users may share MCC information contained within the operations brief to other Virtual Port users only by enabling a “sharing checkbox”. Upon doing so, the information will be shared to the “San Pedro Bay (SPB) operations brief” and accessible to all users of the Virtual Port system.
- MCC Asset Management - Create, update and delete agency information, agency assets and member details.
- MCC Event Management - Create, update and delete event information.
- MCC Event Sketch - Add additional event information by manually placing “sketched” symbols on the map based upon a standard symbol palette.
- MCC Notifications -
- Integration with Virtual Port email server for notifications
- Notification lists that can be enabled by selecting a “checkbox” within events to send updates to the selected notification lists
- Ability to attach files to email notifications
- MCC Reports
- Event Stats Report
- Asset Stats Report
- Post Event Report
- Current Available Assets Report
- Time Line Report
- Vessel Interdiction and Coastline Security Enhancements (special application/stand alone) - Configuration and training on the use of Esri’s Geospatial Predictive Analysis Tools (GPAT) for vessel interdiction capabilities including predictive analysis of small craft entering the San Pedro Bay area.
- MJOB Clarification/All Stakeholders Edition - Multi-stakeholder MJOB capabilities are user based and assigned to organizational working groups according to access approvals.
Enhancements
- USCG Encrypted AIS Feed - Integration with the USCG encrypted AIS vessel feed
- ICS Integration - Witt O’Brien’s CommandPro tools support USCG and Port Operations Threat Reduction group standard Incident Command System forms. Events can be “escalated” into an ICS based structure. Store and recall all required documents and forms from the ICS module.
- Manual Berth Entry - Manually enter berth status showing what vessels or barges are currently at the berth location. POLB currently performs manual checks of berths in order to supplement AIS tracked vessel locations and is entered into a separate system. Combines status checks with other Virtual Port data sources for a comprehensive and up to date view of tracked and un-tracked vessels.
- Vessel Tagging - Tag a vessel arriving, in port or leaving port so that vessels of interest can be identified and shared among stakeholder agencies. Receive notifications when vessels of interest enter the port area.
- Archiving /Re-Play - Archive and replay tracked feeds by start and end date and time. Re-play tracked feeds for review.
- GeoFence Enhancements - Add three additional criteria to GeoFence capabilities such as alert for non-AIS tracked vessels entering and area or a moving geofence that can follow a vessel and alert when another vessel is within a given proximity.
- CalTrans and CHP Feed - Integration with CalTrans and California Highway Patrol (CHP) feeds for regional traffic and highway incident conditions; including incidents, closures, message signs and traffic cameras.
- Additional Vessel Reports - Two additional vessel reports based upon available data within the Virtual Port platform. For example, show all Blue Force vessels available for response.
- Small Craft Tracking - Log small craft vessels for historical archiving and access. Bag and tag vessels that enter capture zones within the port. Information may include a photo and CF number, type, color, etc.
- POLA Cameras - View Port of Los Angeles cameras as provided through the port’s LexRay media streaming server.
- Advanced Mesoscale Weather Analysis - WeatherFlow Regional Atmospheric Modeling System (RAMS) provides a fine grain of detail not available from other models. Live weather information and seven day predictions. Link to WeatherFlow sensor information for each weather sensor so that historical weather data can be obtained. Information can be valuable to the port during hazmat events where detailed wind patterns can be crucial.
- Calls for Service -Integration with the City of Long Beach systems for receiving calls for service information feeds (e.g. call type and location).
- Two Factor Authentication - Two-factor authentication capabilities within Virtual Port. Use key fob or mobile phone based number generator for the second factor authentication.
- IHS Janes - Integrate IHS Janes vessel data within the Virtual Port environment in order to provide additional vessel details. Contains between 50-65 fields of data.
- National Grid GIS Reference Information - Access to the US National Grid for use during large scale disaster events.
- GeoPOLA and POLB GIS Reference Information - Integration with GeoPOLA and POLB GIS reference data sources for up to date access to GIS data sources. Reference information such as utilities, leases and imagery.
- Predicted Tsunami Inundation Areas GIS Reference Information - Access to the NOAA Predicted Tsunami Inundation Areas for use during large scale disaster events.
- Hazardous Materials Locations - Access to the Hazardous Materials Locations data for use during large scale disaster events. Information provided by the City of Long Beach including the address, name and type of hazardous materials located within the port area.